Housing Scorecard

Days on market, meanwhile, increased by 15 days in January.

The local housing market performed well in December, according to the final Phoenix Housing Scorecard of 2024.
Housing inventory expanded to over 21,000 properties in November, according to the Phoenix Housing Scorecard.

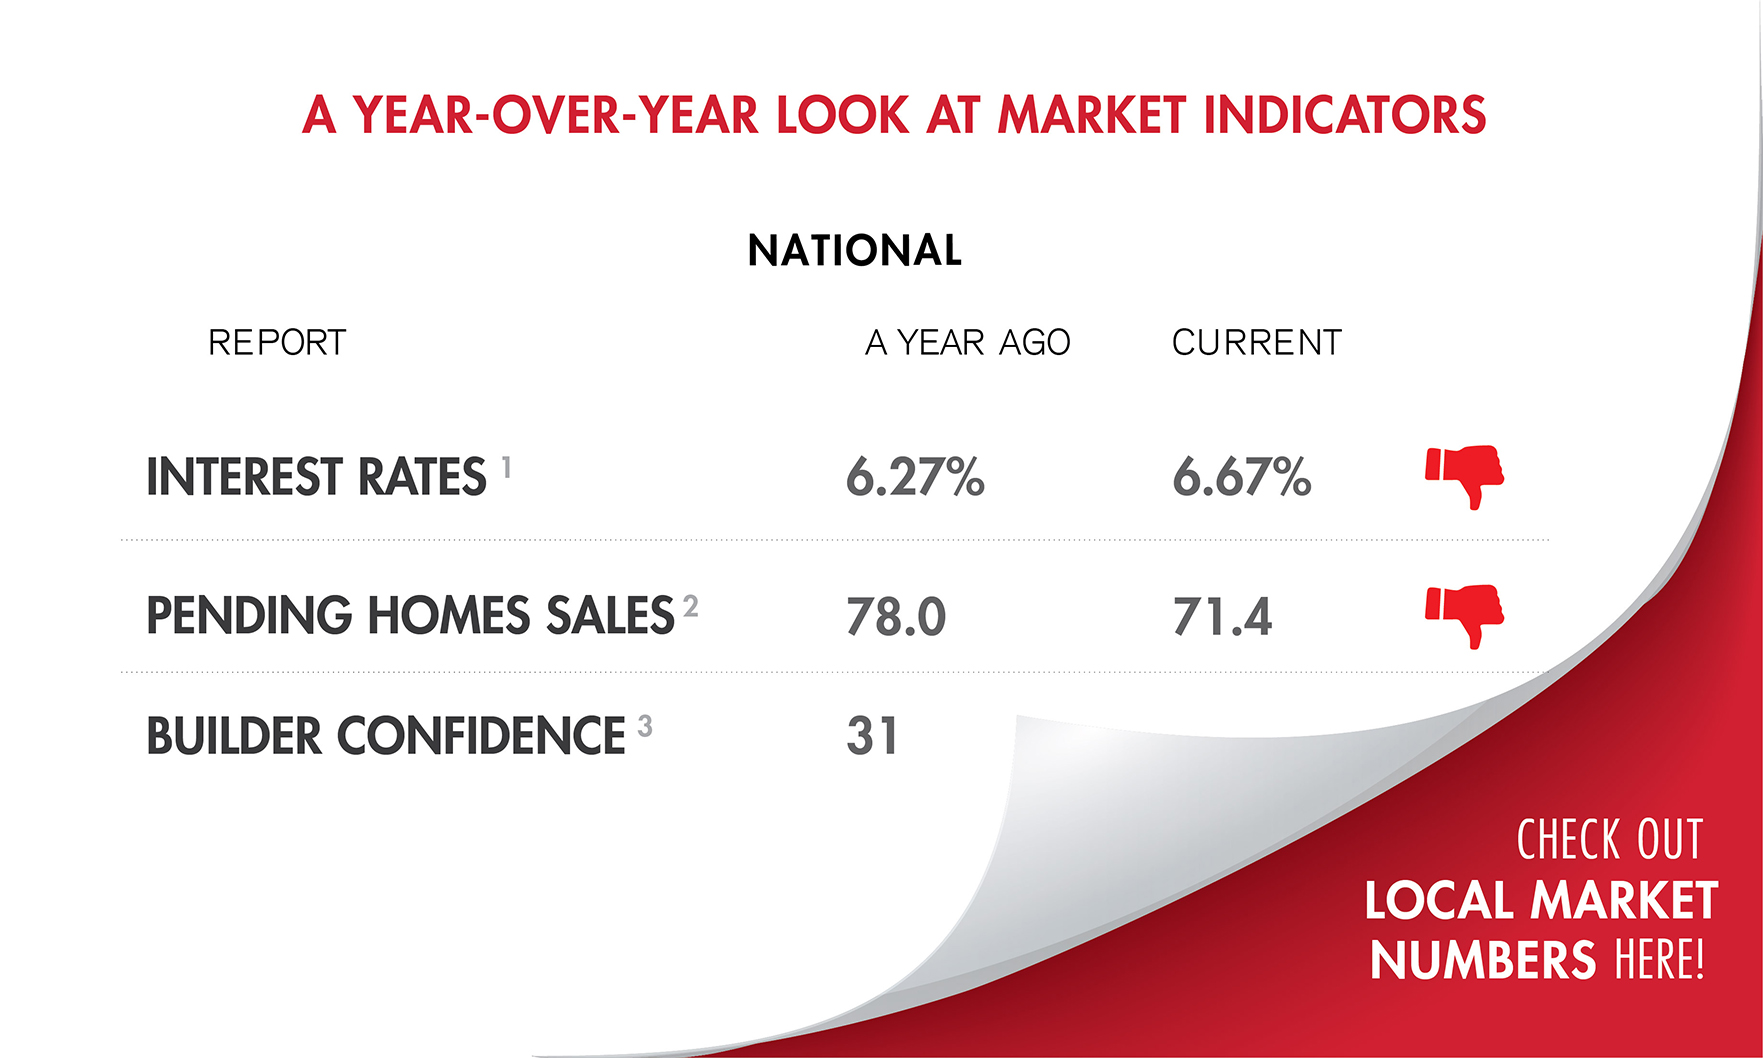
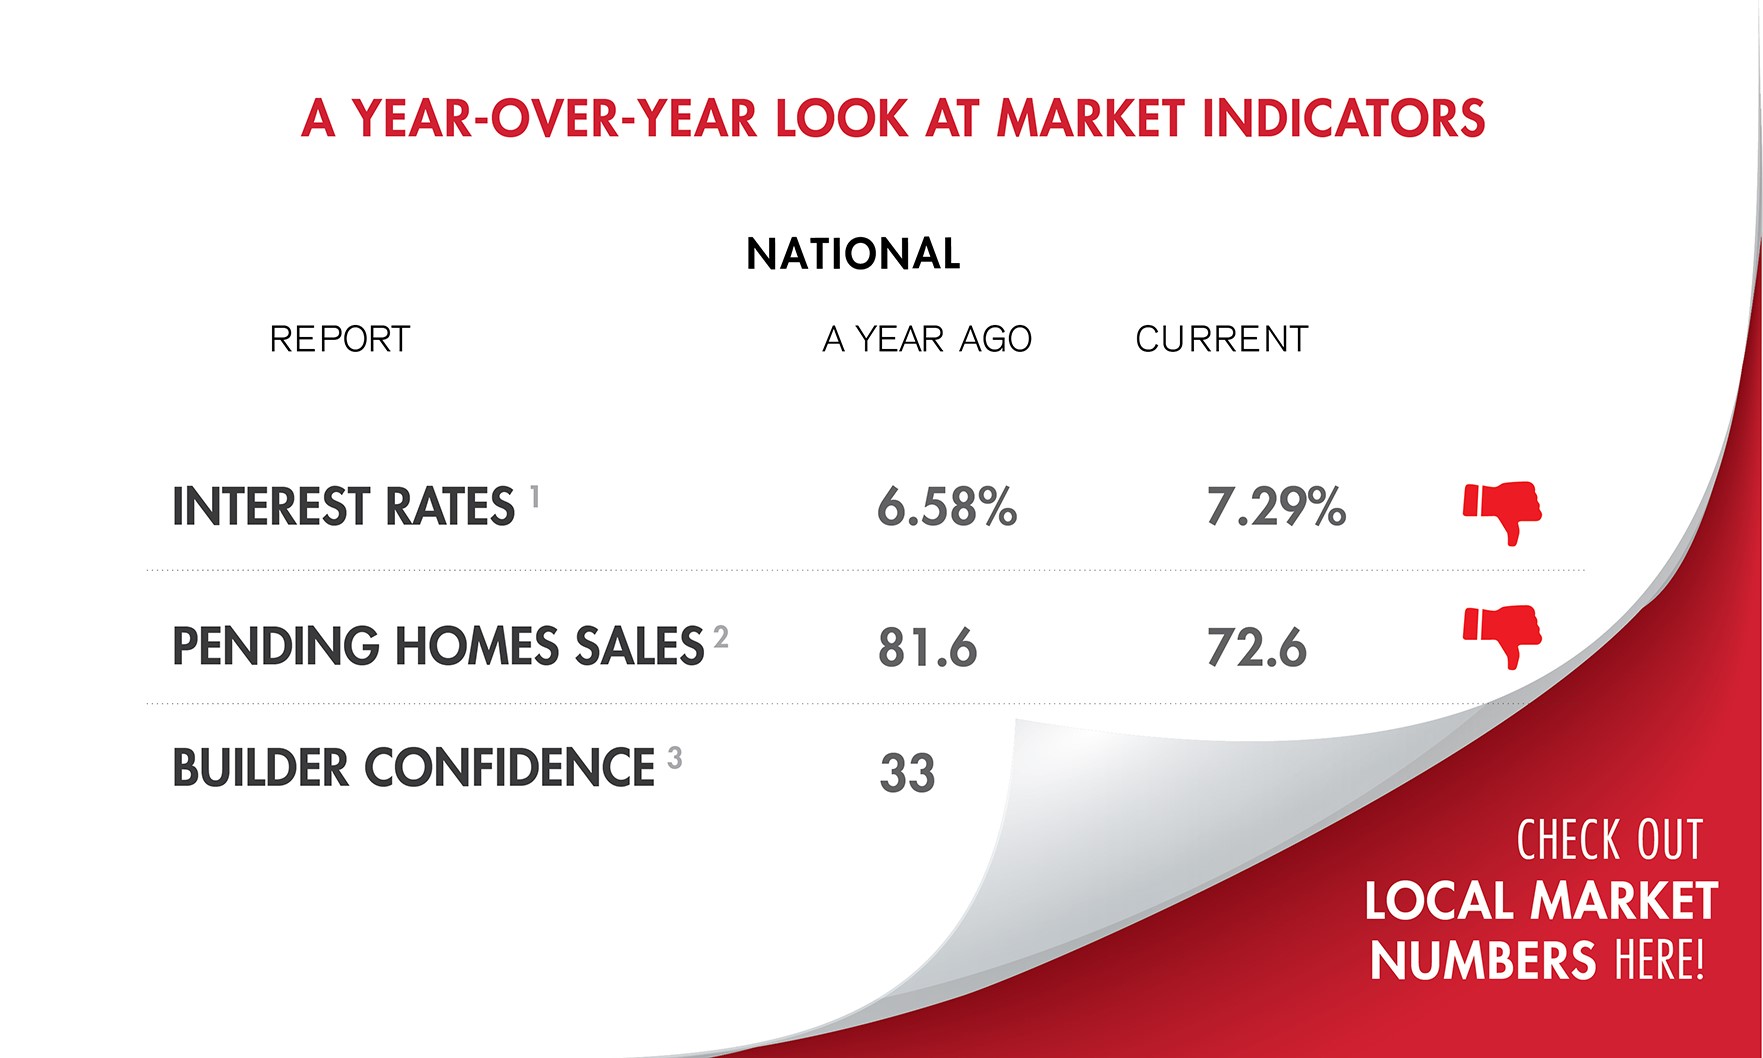
Inside the latest year-over-year data for the Phoenix residential real estate market.

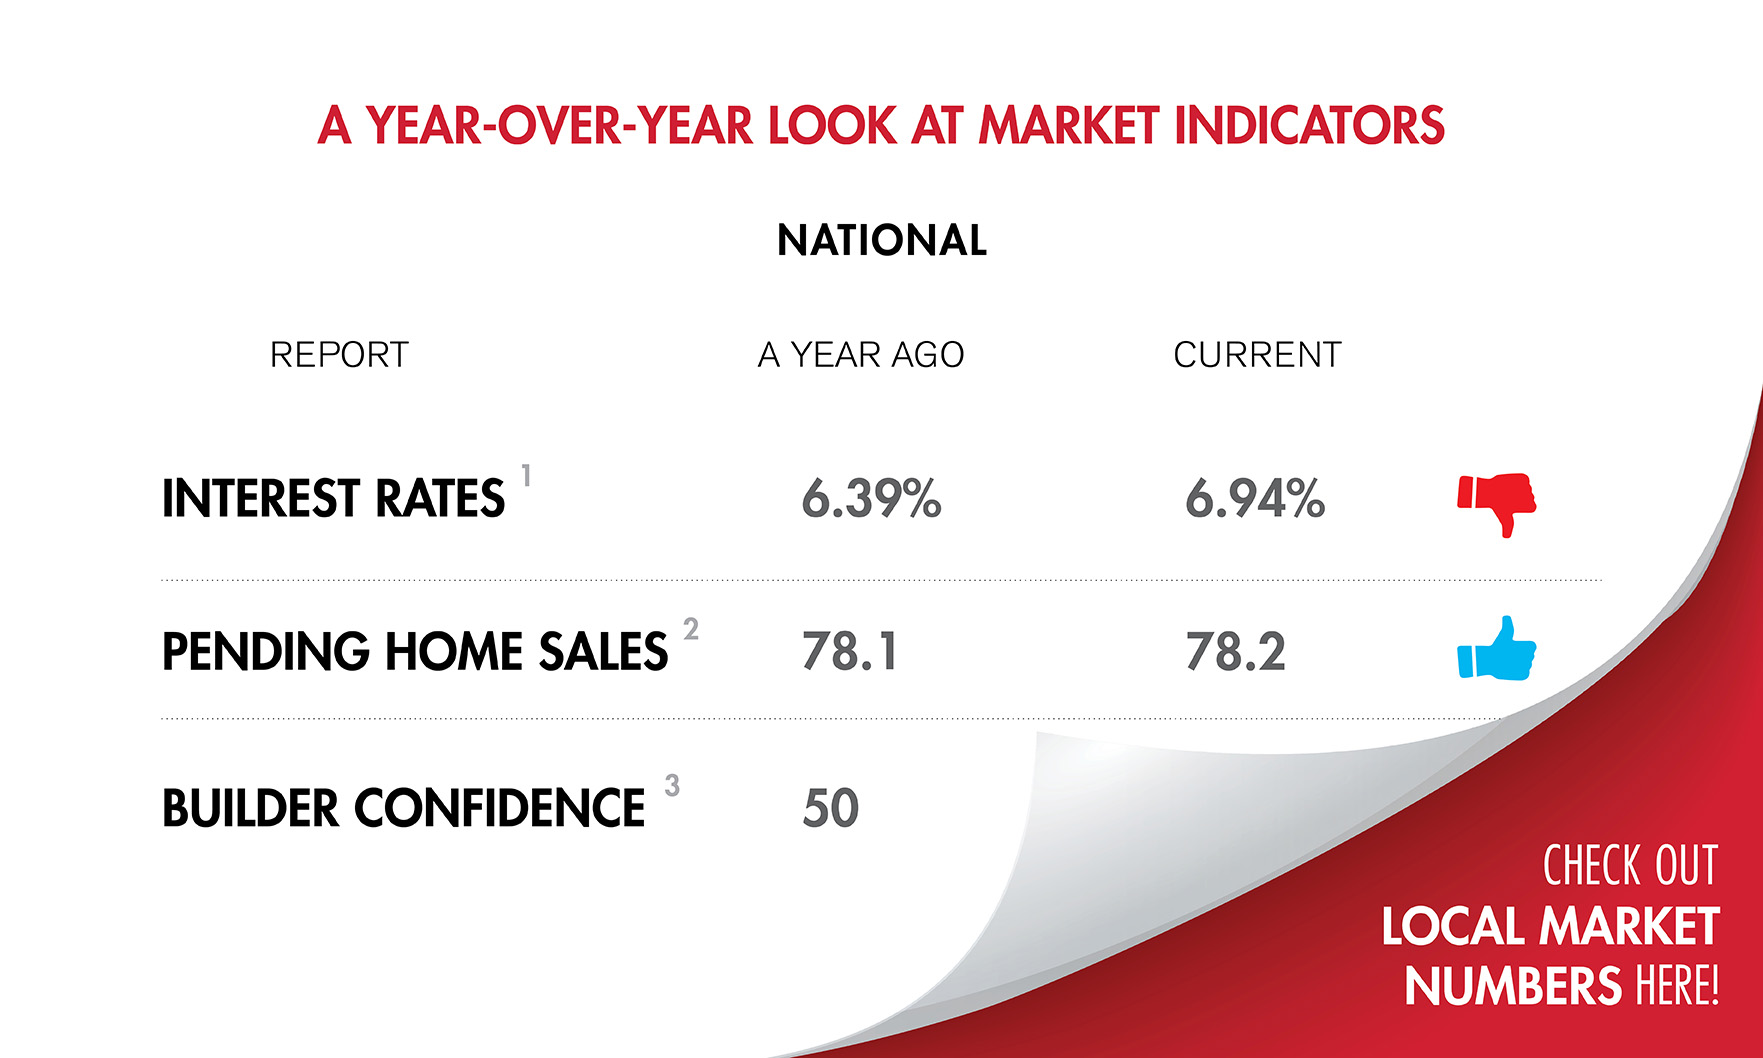
A look at key indicators in The Valley’s residential real estate.

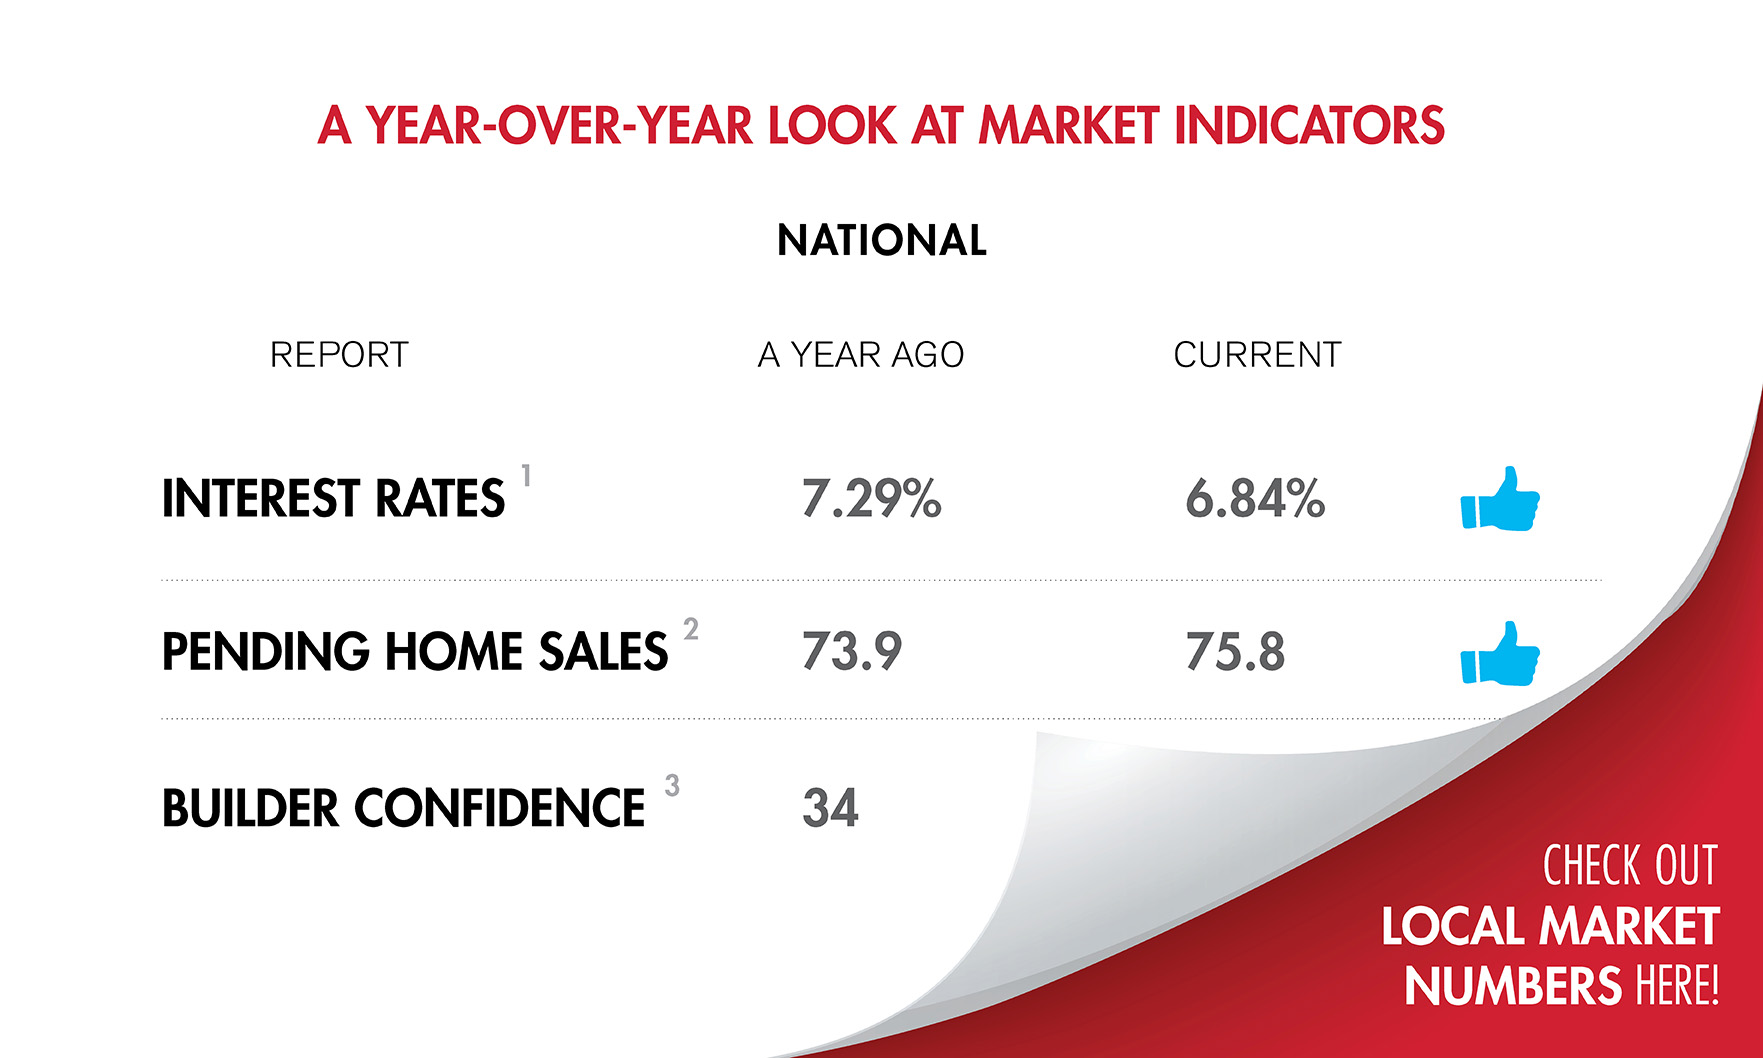
A year-over-year look at key indicators in the Phoenix residential real estate market.

Housing inventory continues to grow amid decreased existing-home sales, according to the Phoenix Housing Scorecard.

Homes took less time to sell in Phoenix last month as existing-home sales fell annually.
Amid increased home sales, prospective buyers had more options when entering the housing market this past month.

Homes sold slightly faster in Phoenix last month.
Active inventory increased in Phoenix last month as existing home sales dropped.

Existing home sales increased in Phoenix last month as days on market fell, according to the latest Housing Scorecard.

Although sales decreased last month, homes that did sell sold faster than they did a year ago.
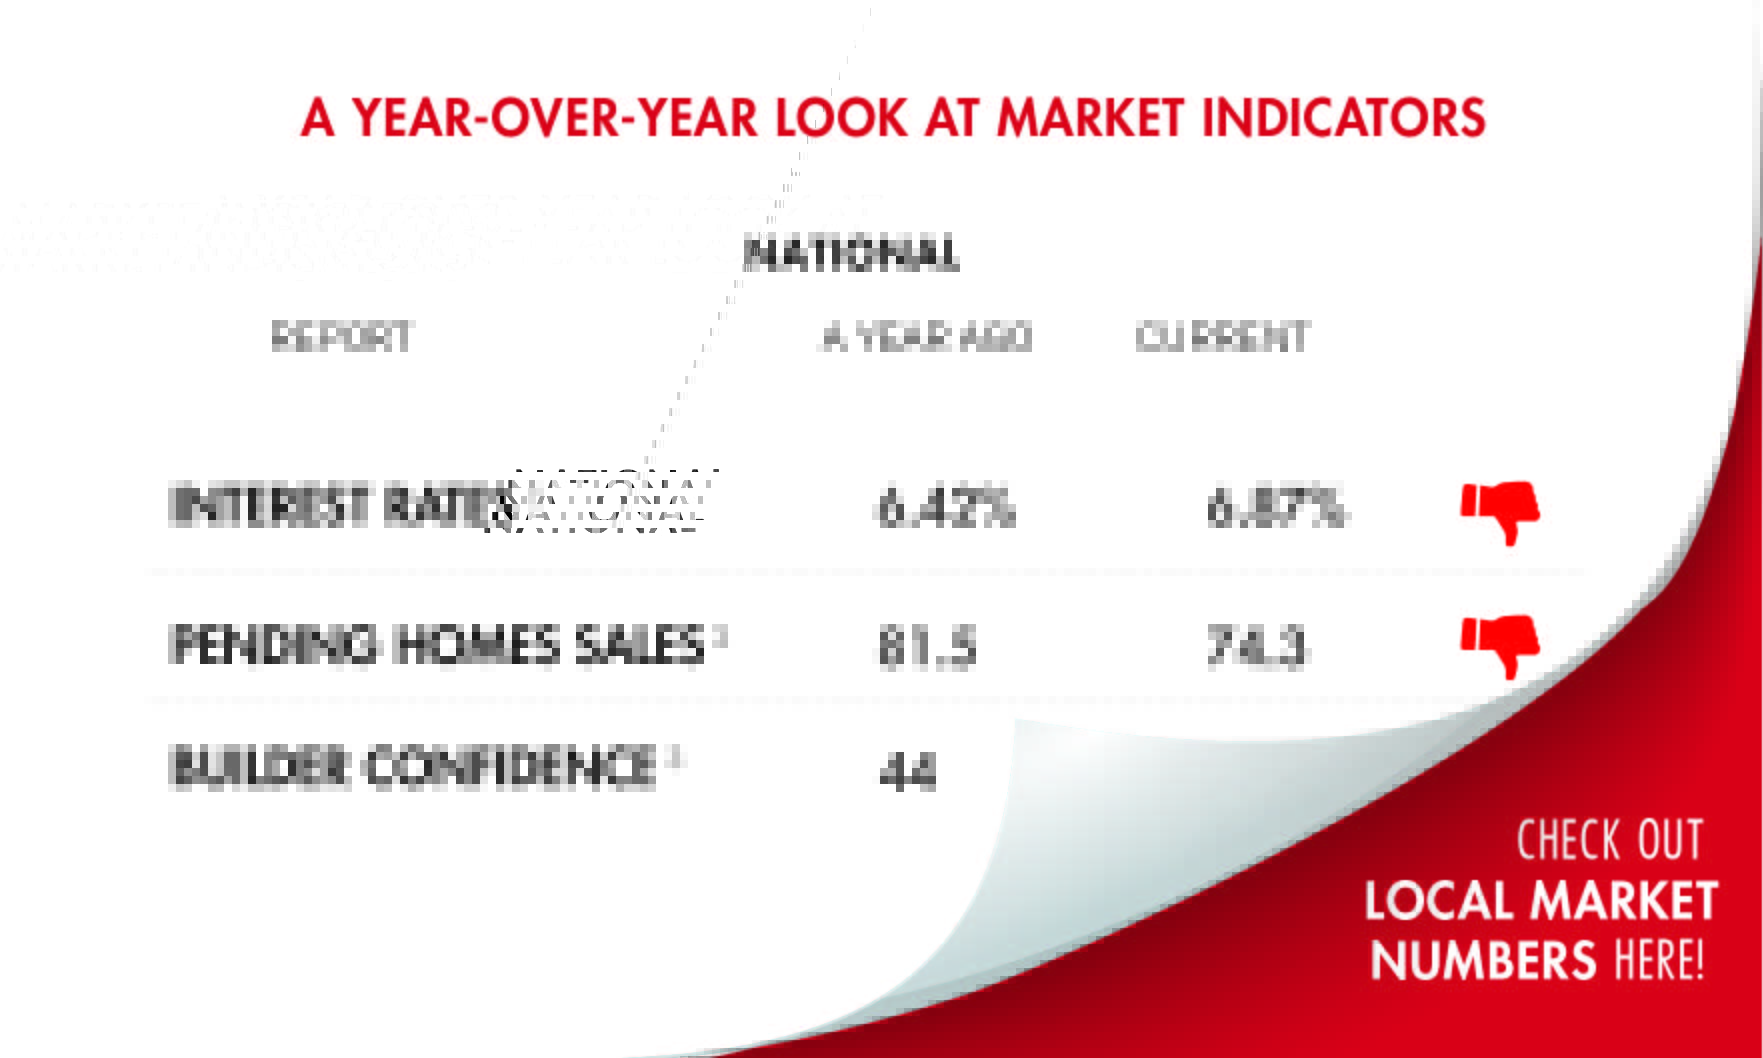
A year-over-year look at key metrics in Phoenix real estate.
Amid national increases in builder confidence, housing starts increased in Phoenix in November, according to the latest Housing Scorecard.

Despite year-over-year increases in housing starts, Phoenix’s active inventory has decreased by more than 6,000 homes.