Housing Scorecard
Buyers will have plenty of options in the new year thanks to expanded Phoenix inventory, according to the final Housing Scorecard of 2025.

Phoenix homes sold during the past month stayed on the market about a week longer than homes sold a year prior.

Housing starts declined in Phoenix this past month, according to the latest Phoenix Agent Housing Scorecard.

Existing home-sales increased in Phoenix over the past month, according to the latest Phoenix Housing Scorecard.

Existing-home sales and inventory rose in Phoenix over the past month, according to the latest Housing Scorecard.

Existing-home sales and inventory increased in Phoenix last month, according to the latest Housing Scorecard.
Housing inventory and housing starts increased in Phoenix last month, according to the latest Housing Scorecard.

Existing-home sales increased in Phoenix last month, according to the latest Housing Scorecard from Phoenix Agent.

Existing-home sales rose in Phoenix last month, despite nationwide economic uncertainty.

Existing-home sales and inventory rose in Phoenix last month, according to the latest Phoenix Housing Scorecard.

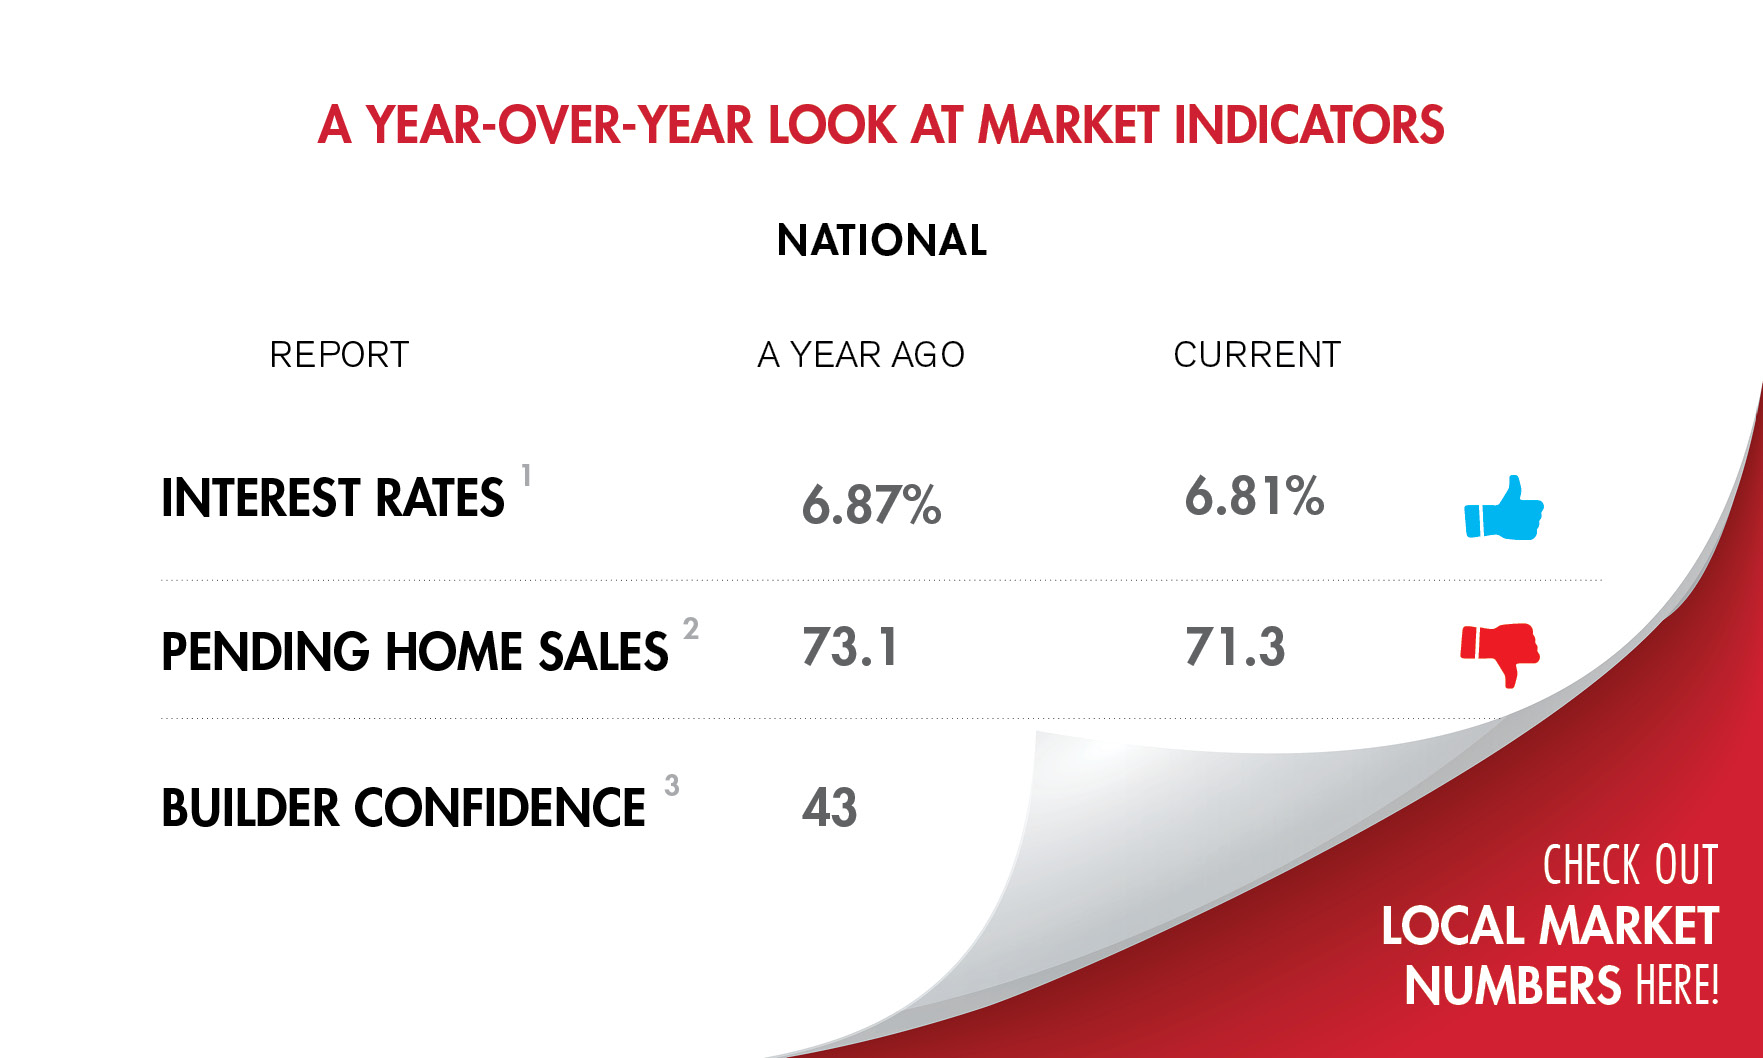
Nationally, pending home sales, builder confidence and unemployment worsened in February, although the local Phoenix market looked steady.

Days on market, meanwhile, increased by 15 days in January.
The local housing market performed well in December, according to the final Phoenix Housing Scorecard of 2024.

Housing inventory expanded to over 21,000 properties in November, according to the Phoenix Housing Scorecard.

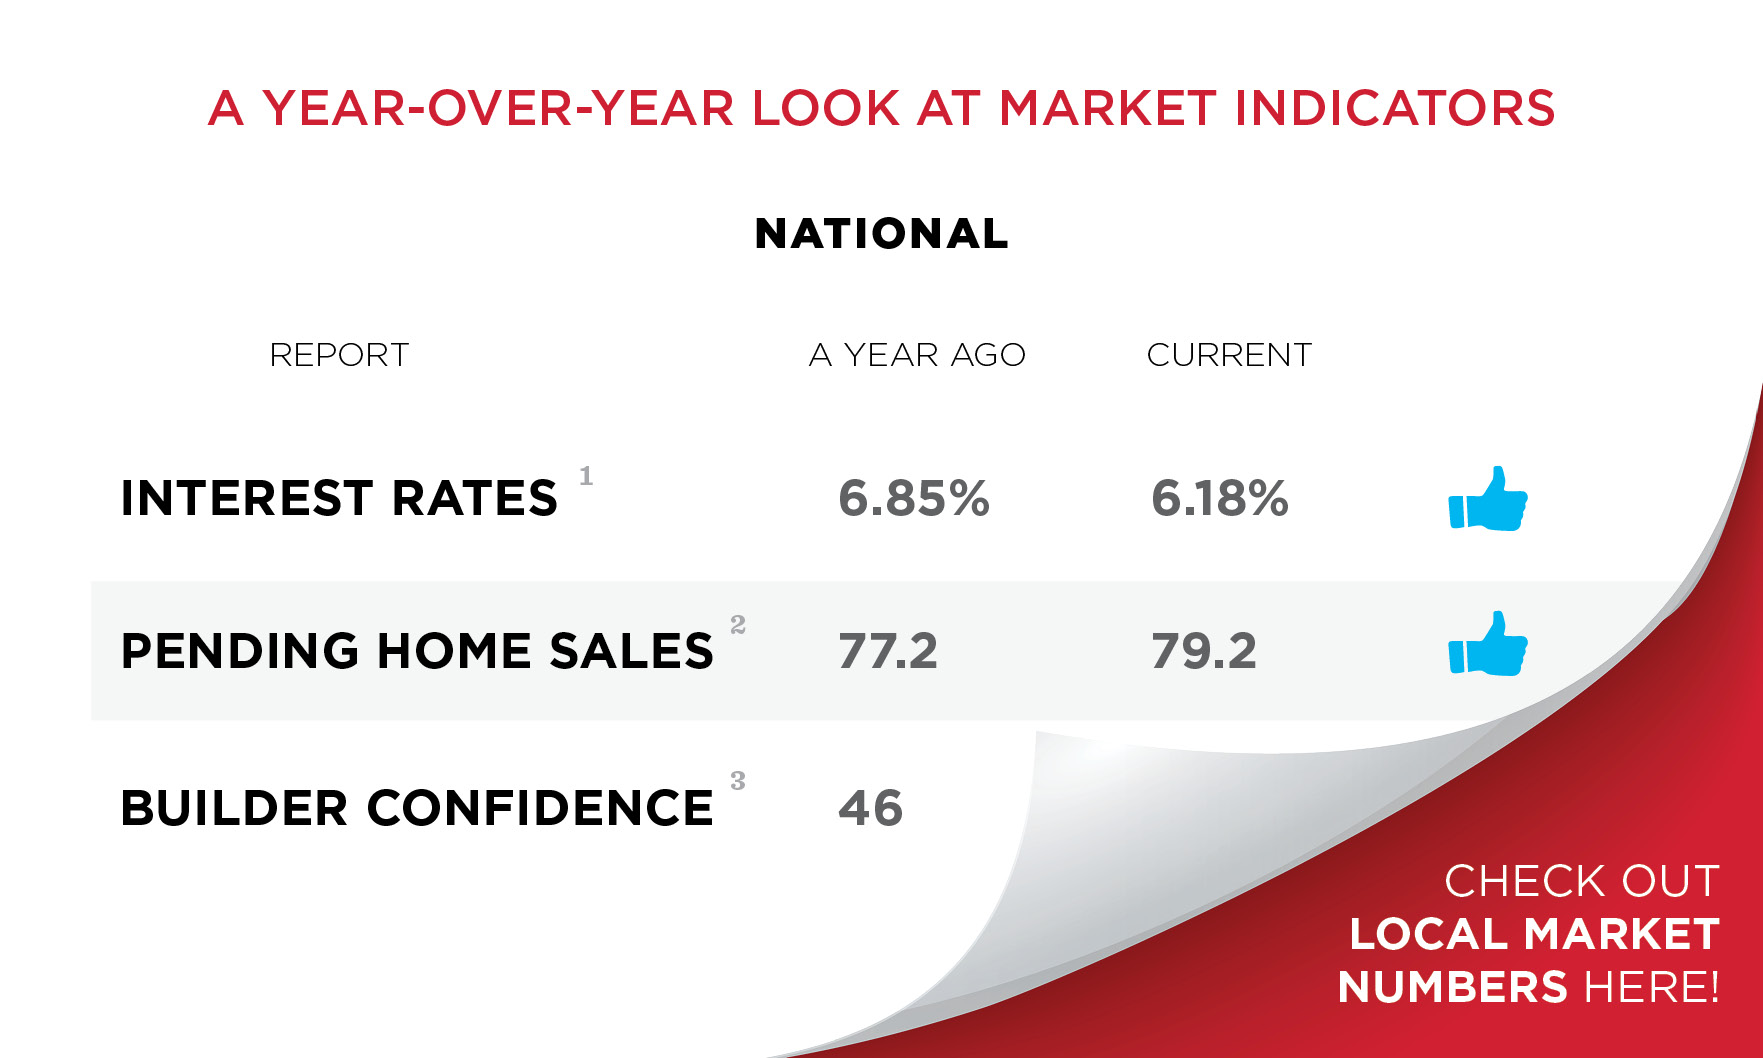
Inside the latest year-over-year data for the Phoenix residential real estate market.

A look at key indicators in The Valley’s residential real estate.